Below are the Primary Indexes and their detailed values. Hover over the data points to see the exact numbers for each price point. Like real-life indexes, each one represents a mix to stocks that focus on a specific sector of the economy where items can be bought and sold. M&G focuses on the mining sector, JSI on wood, and FEGRAM on shops and products. To view the specific items represented within the indexes, you can view the Item Index page.
Monthly Volume Reports
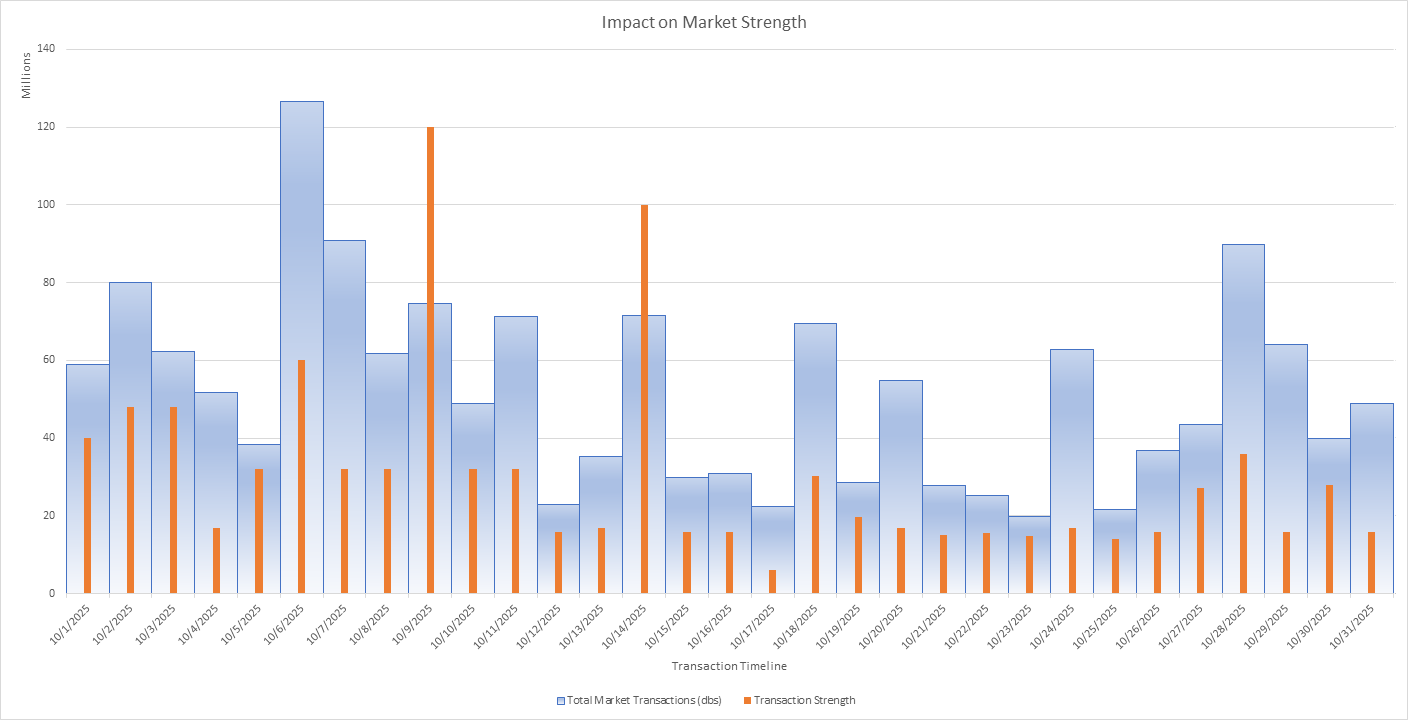
The Monthly Trade Volume report indicates how healthy the market is over the past month. Higher bars mean more activity, in the same way a jobs report in the real-world will indicate stronger performance the higher it goes.
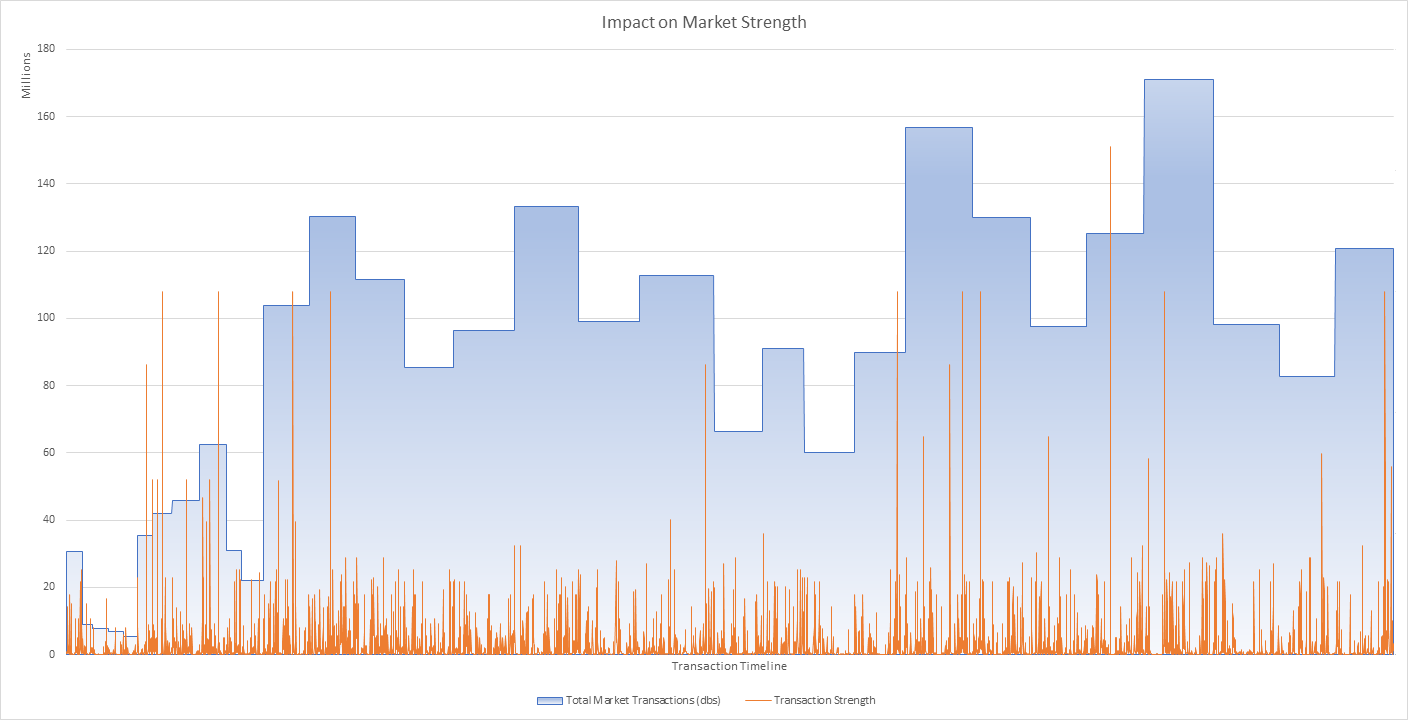
Alternative view of the chart above, sorting the transactions evenly by day instead of one pixel per transaction.
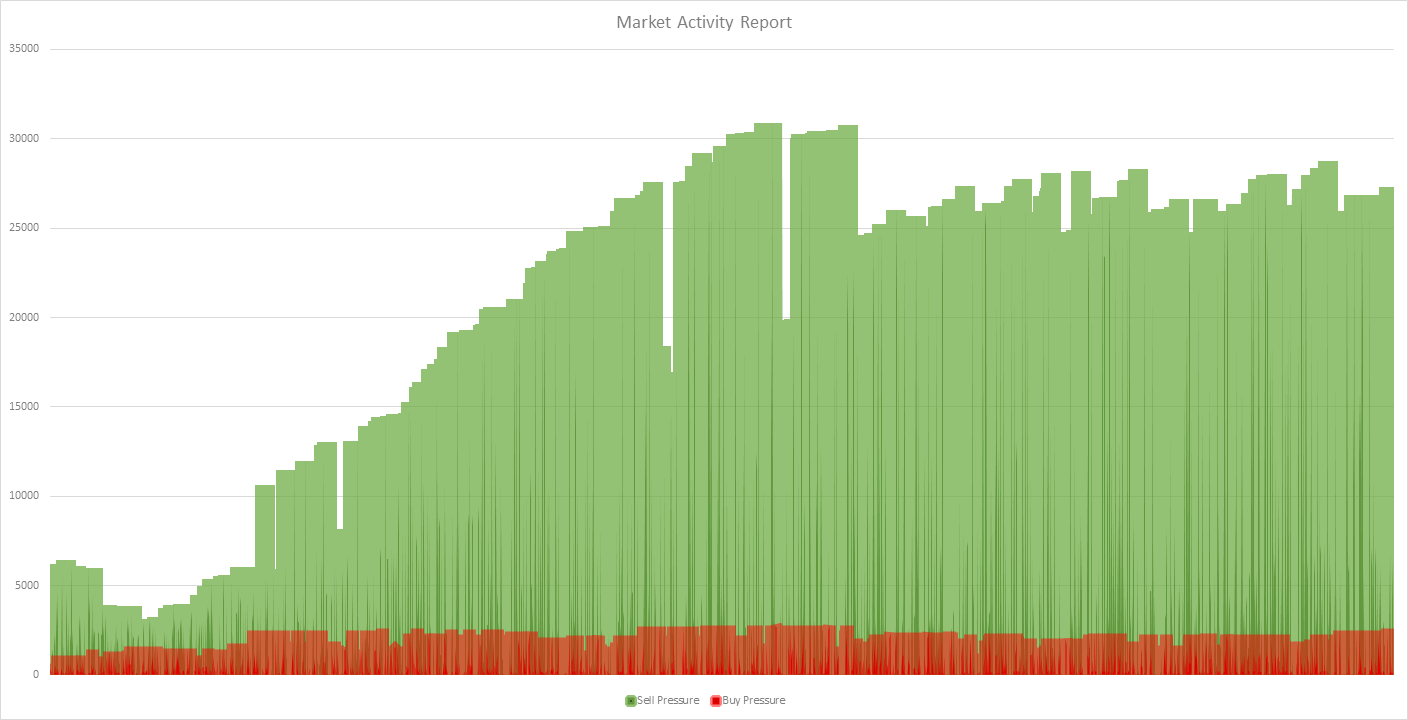
Market Strength Reports
The chart below shows the strength of buyers and sellers in the market. The brighter the bar the stronger the influence. Green represents sellers and Red represents buyers. This is similar to a consumer spending report in the real-world, where higher bars mean more buying and selling interest and thus more growth and production.
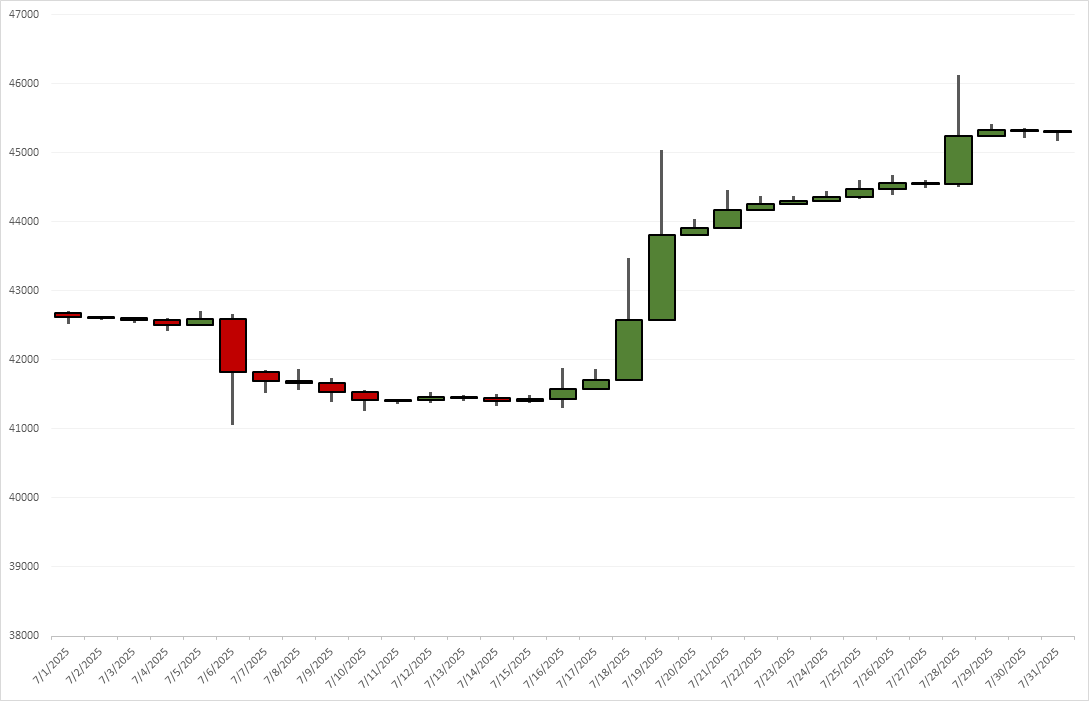
Index Specific Performance
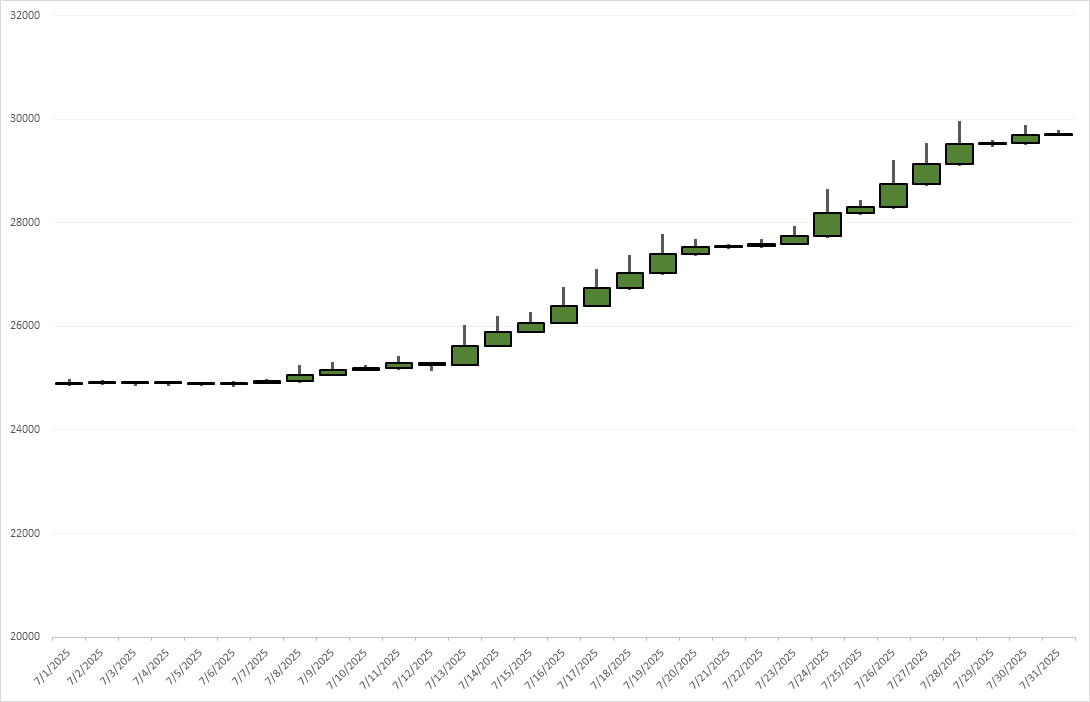
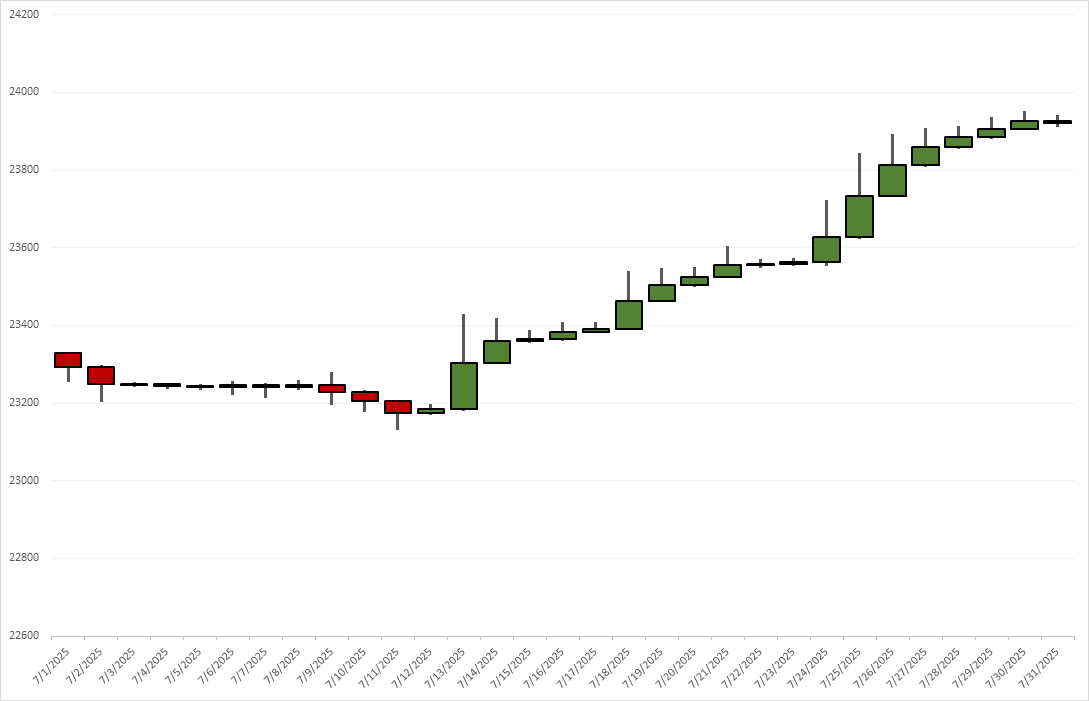
The candlestick chart below shows the daily performance of each sector (called Primary Indexes in GISE). There are three sectors which are constantly measured. The M&G Index measures mining and crafting with the value equating to the average amount of money you will make with each Pickaxe you use. The JSI Index works the same way but uses Timberfelling and Wood Axes instead. The Earnings Index is the average of all buy and sell prices for items sold in shops, weighted by how often they appear (and thus more likely to sell).
NOTE: Charts below only reflect the last 15 days of trading activity. Contact a site admin or ask on discord if you need different timeframes.
M&G Index
JSI Index
Earnings Index (FEGRAM)