This is an instructions page that consolidates the common questions asked from new fleet members. If you have a question that is not shown on this list, you can use the form at the bottom of the page to ask your question or access the Discord page. This page will not answer any questions with answers that can be found on the Tradelands wiki, as the developer’s and their team of writers are more familiar with the game than F&BP.
Stock Exchange / Price Guide Questions
Q: On the price guide, what do the columns mean?
Below is the definitions for the columns on the Price Guide:
- Item Name – The name of the item as it appears on the index. In most cases, it is the same as the in-game item name.
- Last Updated – Date when the ML algorithm last updated the price. An older date means fewer transactions are happening each day.
- Price Per Piece – Price to buy one unit of the item. This is the most common method of listing prices in-game.
- Market Cap – Total value of the market for this type of item. Larger market caps mean it is harder to influence prices. Moreover, this is the likely maximum you can make in one single transaction.
For most players, the “Price Per Piece” is the price you want to use when setting your price points. The Market Cap is useful if you are trying to do bulk transactions.
Q: I don’t see the item listed on the Price Guide that I am trying to sell. Does that mean I can’t sell it?
A: The Price Guide is created by a program using Machine Learning (ML) to determine the price of items actively being sold on the market. If an item isn’t listed, it usually means that the AI doesn’t have enough data to make a prediction of the market price, the item isn’t for sale, or there is no volume of that item on the market at present. If you see items being actively bought/sold that don’t appear on the price guide, it’s possible the ML algorithm doesn’t consider it significant enough to add to the guide.
Q: Can I request a price check of a specific item, or can I have an item added to the price guide if it isn’t there yet?
A: Yes! The easiest way to ask this is in the fleet’s Discord channel. You can also ask on the website. However, be aware that collecting this data is not a manual process. It may take several days (or weeks) before an item will be listed, depending on the volume of data available to the AI.
Q: Why is the Market Cap showing a “-” for an item that is recently updated? Why not use the old amount if it doesn’t exist?
A: The “Market Cap”, also known as Market Capitalization, shows how much of that item can be bought or sold. In other words, its the maximum you can make in a transaction. When a “-” is showing it means there are no true transactions, or “shares,” available for these items, meaning while the price of the item is known the amount you can buy/sell at that price is effectively zero.
We can’t just leave the previous market cap during an update because that is the market cap for a different price and time. The market cap is relative to the current price and time only. However, the fleet can always pull the previous price data if needed.
For more information on how this can be used to build a portfolio in Tradelands, we recommend reading up on how investors use it in real life. Then, use the guides available on this website to build a successful trade company.
Q: What are Stabilization Ratings and how do they differ from the rating given my other price guides?
A: Stabilization is a measure of how predictable the item is to vary from the ongoing market trends. This is similar to Bond Ratings in real life and uses the same principles in determine ratings for Tradelands items. A “Stable” rating is the same thing as an AA or AAA rating, while “Unstable” is C or D. In general, the lower the rater, the more risky the investment, and the greater variance on yield (i.e. return on investment) you can gain or lose.
Other guides base prices on different factors such as seller preferences, while ours is wholly driven by market performance and potential yield. It’s important to use the guide that works best for your specific style of trading when making decisions. Also, it’s important to note that this is not a rating on the overall market stability, so it is not a guarantee of actual outcome regardless of the rating shown on this guide.
Price Index Charts
Q: What do all of the lines mean on the Item Indexes Page?
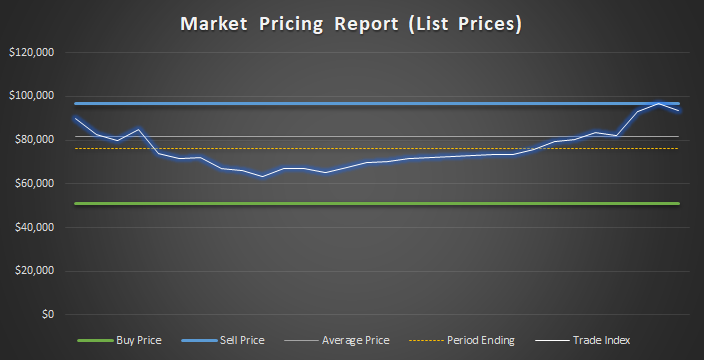
A: There are a total of five lines on this page. I will use the key at the bottom of the chart to explain each one:
- Buy Price – This is the average price that buyers are saying they will buy the item in this specific time frame.
- Sell Price – This is the average price that sellers are listing the price during this specific time frame.
- Average Price – This is the average of both buy and sell prices in this time frame. If the price isn’t exactly in the middle of the green and blue lines, it means that there are more sellers or buyers in this timeframe. In the example chart, this shows more sellers than buyers.
- Period Ending – This is the price point shown on the Price Guide and is based on the formula called the “Index Price.”
- Trade Index – This is how prices trend over that specific time. An upwar slope means prices rose, and a downward slope mean prices fell. This is similar to the average price, but it weighted where newer prices have higher influence than older prices.
Q: How many entries does the chart show for each item?
A: The number of entries will change based on how often the item was being marketed in the time period shown. However, in order to have a chart added/refreshed, they must always meet the following criteria within a 1 month timeframe:
- Have more than 35 price changes in a 30 day period.
- Have at least one pricing event per day in a 30 day period.
- Have at least two different players performing a pricing event in a 30 day period.
- NOTE: It is NOT a requirement to have both a buyer and seller request in this timeframe.
Q: What is the time value for the charts on the Real Time Indexes Page?
A: When you select an item, the “Value Index” chart will have a date in Year/Month/Day format shown. The charts that appear on the page are all synchronized to this date (i.e. they all show the exact same timeframe). Any chart with a date AFTER June 10, 2023 will show 30 days prior and up to the date shown. Charts generated before this were based on a two-week timeframe. The reason we don’t show the actual dates on the charts is because we are limited on space within the chart area.
Q: Can I request you to give me a different timeframe or check prices for an item that doesn’t have an updated chart?
A: Yes! We generate custom reports all the time. If you are in our discord or Slack group, you can send a request and we will generate one for you based on your parameters. If you ask us through this website, we will publish the chart in a new article. If time and availability permit, one of our editors may also provide some additional context to the chart. If you wish to have the chart generated privately, simply indicate this in your comment to us and how you would like us to provide it (email and discord DM are the most common requests).
Fleet Questions
Q: How do I join the fleet’s discord channel if I don’t have it?
A: If you are a fleet member, you can ask in the group’s in-game channel for the link. Non-members can ask the same way. Alternatively, the link is occasionally posted on this website during key events. The Discord server is operated by several different play groups simultaneously. If you desire to be added as a member of F&BP you can send a note in the #requests channel once you are in.
Q: Can I post content to this website as a fleet member?
A: Yes, any fleet member can post to this website. To maintain anonymity, this website has an admin who posts all content on our behalf. This means you will not see your name on your post unless there is a specific need to do so.