Mining Stocks Slide in May
Today, we will dive deeper into the current state of the mining industry in Tradelands. In short, the string of updates in April and May are having a negative correlation on the profession’s profitability. While this will hurt miners in the short-term, the long-term impact on the market may be a net positive.
The Gemstone Hustle
Tradelands places an artificial cap on the number of new materials a miner can add to the economy each month. As we reported previously, the cap was changed which impacted the amount mined per week. Whenever you raise this cap, it means new materials are entering the market. In turn, this tends to lower prices of high-volume items like Iron. The counter trend is that low volume items tend to see a price increase, because their limited stock tends to be easily distributed to buyers.
The most common of these low volume items gemstones. Let’s see how each of them are doing with the new changes.
Amethyst Correction, or Pricing Error
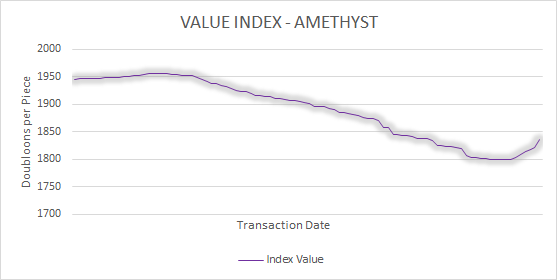
The F&BP Company has a pet name for Amethyst – “The Rookie Mistake.” That’s because this gemstone is often thought to be on-par in value to Sapphire when instead it is on-par with Ruby and Emerald. This is due to new players being ignorant of what makes Sapphire more expensive. In addition, if you follow the mining statistics that we report periodically, you see they are statistically comparable to Emerald and Ruby as well.
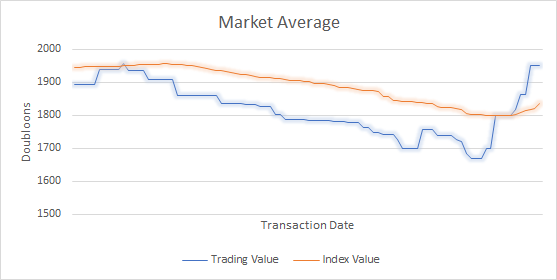
The problem rears its ugly head whenever new entrants to the gemstone market show up. The small valley and subsequent upward momentum at the end of last week is due to this trend. It’s easier to see on the Market Averages Report. It could be signs of a new price correction initiative, so we will keep monitoring it.
Ruby and Onyx Fall
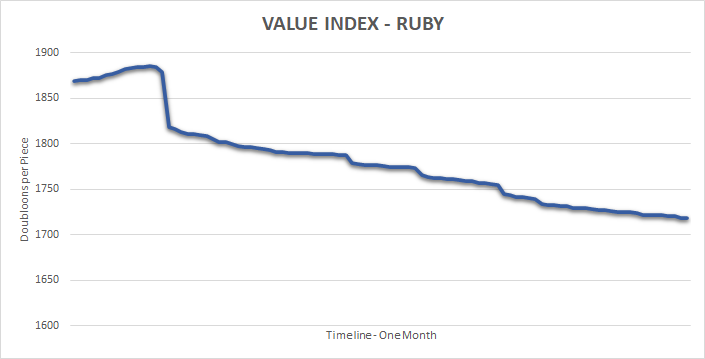
Ruby and Onyx both took losses last month. Ruby stayed consistent with the overall market and isn’t doing anything alarming. In fact, this has been one of the most stable materials all year, hovering around the $1.7k price point. You should view the fall as a continuation of this stability rather than a concern long-term.
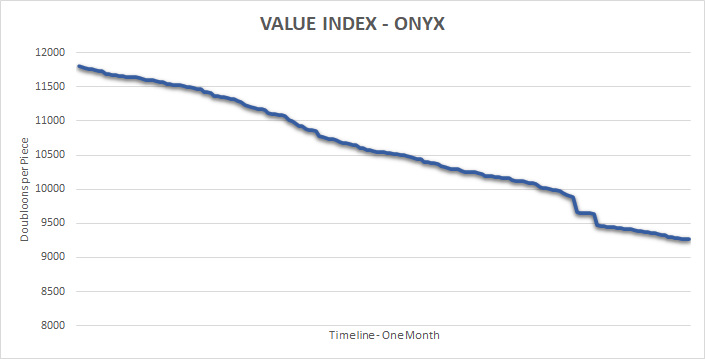
Onyx took a pretty bit hit, but we aren’t surprised. While we’ve never actually reported on it, we don’t advise making mining decisions around procurement of Onyx. The market is too small, the materials are too hard to get, and the in-game benefits of Onyx make this a poor use of time and effort.
Sometime in the future we will make a full report on our considerations around Onyx. But this material is the equivalent of Blood Oak to Timberfelling. We don’t recommend making investments in this material at this time.
Emerald and Sapphire Beat Expectations
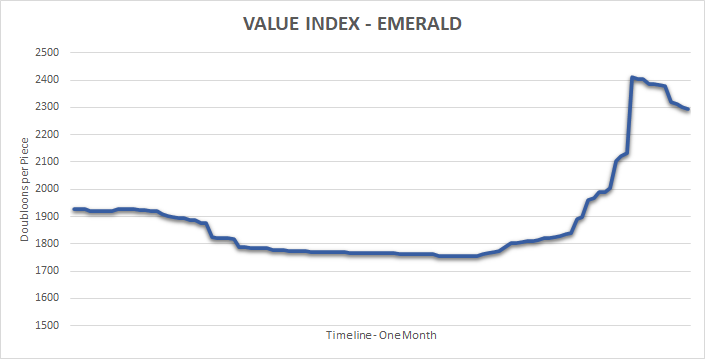
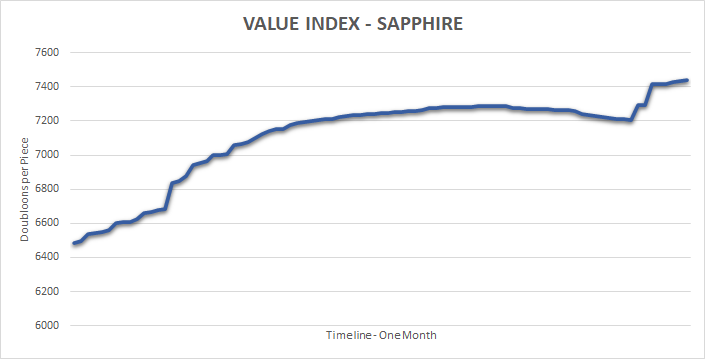
If you are going to invest in gem mining, Emerald and Sapphire have the highest return on investment. That means limiting the number of pickaxes you make out of either material, since you can trade them at better margins. Of the two, Sapphire is typically more stable because it is the only material that can produce Electrosteel.
Emerald is typically used in gemstone mining, which maintains its value, but there are enough alternatives that it isn’t as stable. In fact, the only reason it was able to avoid taking a loss this month was due to a well-times price correction that happened after the Demeter went off sale. Now, I don’t want to blame every trend on the release of a single ship, but in this case it mattered because of market capacity changes.
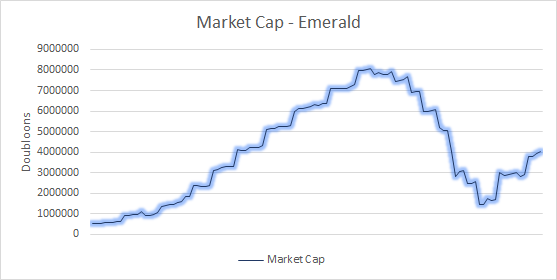
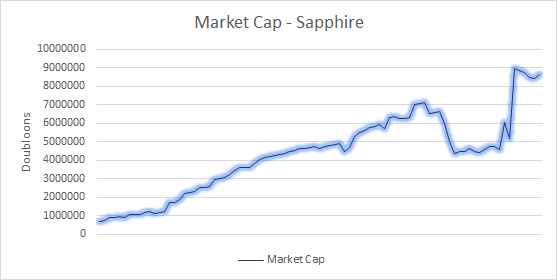
In both cases, we can see the same trend. As time went on, traditional buyers in this market suddenly became sellers due to an economic fire sale. Once this financial distress concluded on May 25th, we see an almost immediate return of the traditional buyers back onto the market. That means these materials will continue to be stable options for anyone wanting to get into gem trading. The only thing we continue to see is an overabundance of Sapphire. This should eventually correct itself once more Electrostorms appear, causing demand to rise.
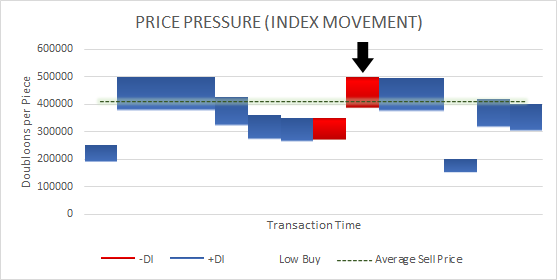
Copper Corrects Too Early
We talked a lot about good timing on the gemstone market and how it impacted the stock market. Now let’s look at Copper and see what poor timing looks like.
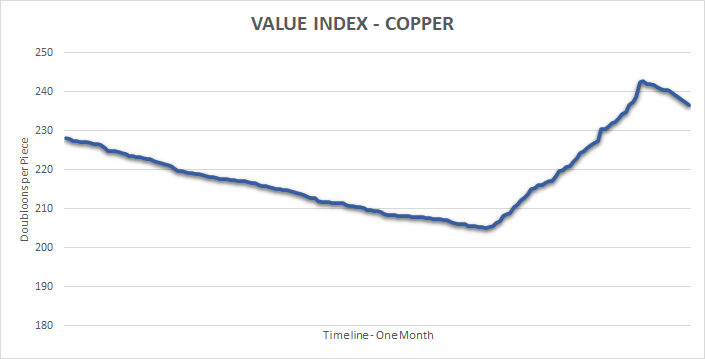
Unfortunately, sellers misjudged the price correction on Copper and started the increase about a week and a half too soon. The result is what you see here, a temporary increase that inevitably resulted in a downward trend. What is hard to see, but will become more evident next month, is the speed of the decrease the next time around.
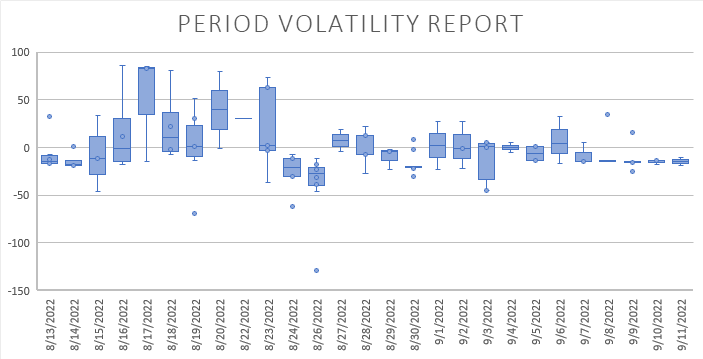
Long-term up and down fluctuations like this are actually harmful. It’s a sign of volatility that makes it less likely that the market will trust a price change to “stick.” This results in a negative feedback loop. The more it happens, the more volatile it becomes. The more volatile it becomes, the more likely it is to collapse.
This one jump, which was successful at creating a +3.62% increase, is already causing warning signs that suggest Copper will fall below $190 per piece before another correction can happen. That means this single, poorly timed, increase will have cost traders -$40 per piece in the long-term value of Copper for the ability to create just $8 per piece of profit for a few weeks.
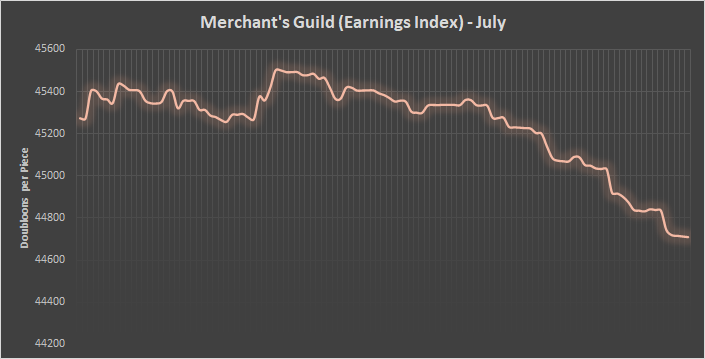
Gold Gets Crushed
If you weren’t paying attention to the Gold market over the past few months, I’m sorry to say you are probably too late to do anything about it now. We’ve been reporting since March that there was an ongoing price correction for Gold. That movement peaked in April, topping out at almost $5k per piece before declining to a stabilization point of $3,490 per piece. In other words, Gold selling was extremely profitable for a while.
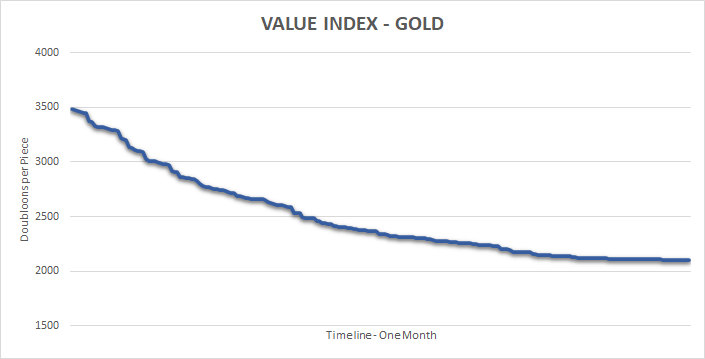
Today, the price of Gold is back to it’s February close. The buying behavior seems to indicate that it will stabilize at this level and we think that is a good thing. Gold is one of the most versatile metals and is used in almost every level of crafting. Not to mention it is useful for Timberfelling and Mining, meaning it should keep a price point that is higher than most other materials of the same type.
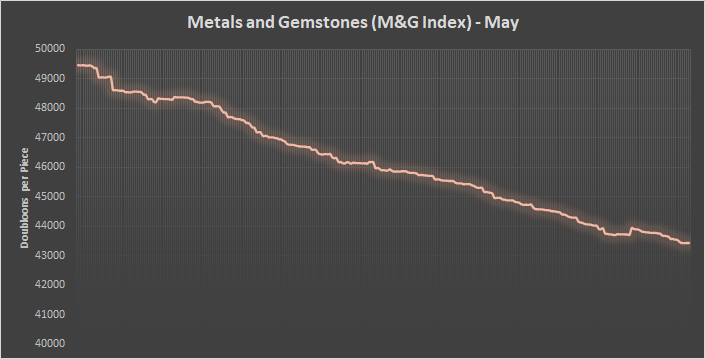
What About Iron?
We are saving the best for last, so lets talk about Iron. Unfortunately, this is probably the most important in terms of the future prospects of the mining industry. It’s also the most boring because the answer is obvious.
Look, we aren’t going to dance around this. Iron is trending down at an unprecedented rate (-16.49%) and shows no signs of slowing. While the model doesn’t show it yet, we believe the price will go under $200 per piece within the next few weeks and will only start to stabilize once it reaches that point. However, our models are reactive (based on historical data) so we aren’t able to officially report that yet. But if you are a trader on the market, be advised that the market correction on Iron is real, and was probably intentional on the developer’s behalf. If you are continuing to fight against this trend, you are probably going to lose.
Where is Blued Steel?
Blued Steel may go down as 2022’s greatest disappointment to-date. Believe me, we added it to our ML script the day it was released and even set it to fast track. The reason it doesn’t show up anywhere is because, even with the fast track in place, it hasn’t hit the threshold to Initial Public Offering (IPO). Unlike some of the premium woods released in April, Blued Steel isn’t even close to being ready.
As of now, it only meets 8% of the criteria needed to qualify. That makes this a risky buy, but it’s also pretty easy to calculate the value since it’s just the aggregate of the other materials needed in construction. So, if you are really needing a price, use the Price Guide to help you until it gets officially listed.